The win-rate illusion
Know When Not to Enter · Lesson 3/29
The problem: 54.64 % winners and a loss
My Genesis Test fleet won 54.64 % of its trades. More than half. It ended at -3.98 USDT [1].
A win rate above 50 % feels like proof that a bot works. I read it that way. The audit showed something else.
The short side had made +10.37 USDT. The long side had lost 14.35 USDT. The win rate had hidden both facts from me.
Why it happens: the win rate counts, it does not weigh
The result of a system has two parts. One part is how often it wins. The other part is how much it wins and how much it loses each time. The win rate covers only the first part.
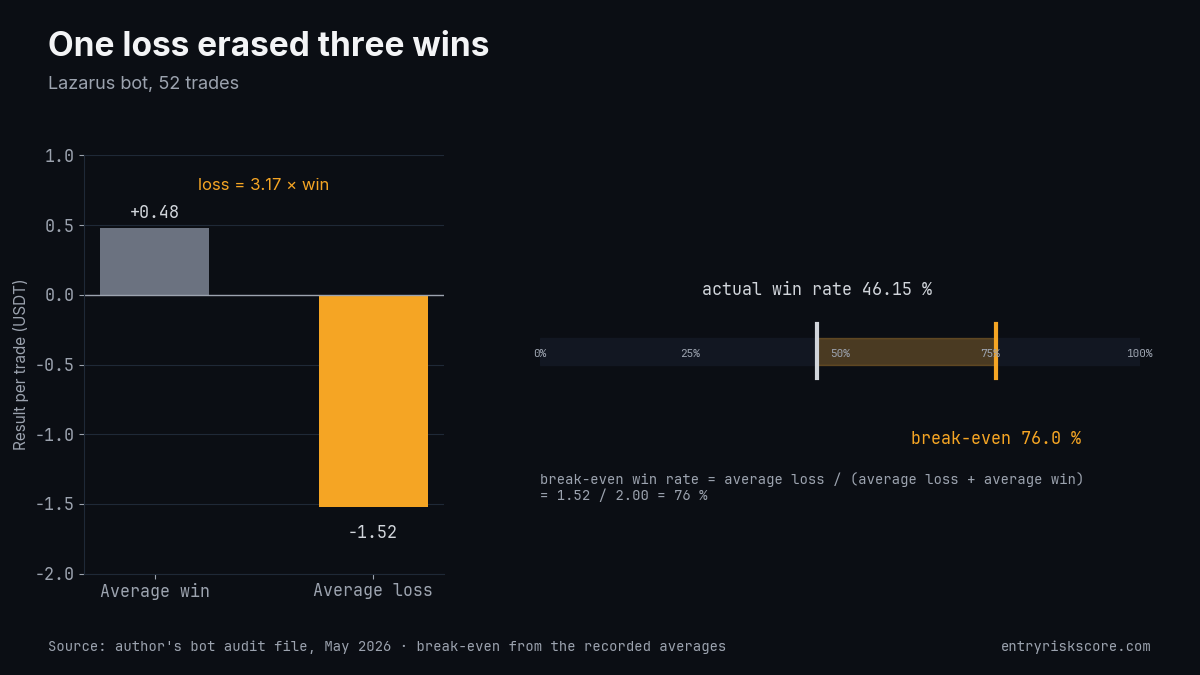
Lazarus shows the second part clearly. In a 72-hour audit it made 52 trades: 24 wins and 28 losses, a win rate of 46.15 %.
The average win was +0.48 USDT. The average loss was -1.52 USDT. One losing trade cost as much as 3.17 winning trades brought in.
The break-even win rate
There is a simple way to see what that ratio demands. Divide the average loss by the sum of the average loss and the average win. For Lazarus that is 1.52 divided by 2.00.
The bot needed to win 76 % of its trades only to reach zero. It won 46.15 %.
Why were the losses so much larger? The logs point to the design. Gains were taken quickly and stayed small, while losses ran to the hard stop-loss.
That design produces many small wins and a few large losses. A high win rate is then a property of the design. It is not a sign of an edge.
The opposite case exists too. A system can win only 35 % of its trades and still do well, if its average win is several times its average loss. A low win rate is no more a verdict than a high one.
What helps: four habits
- Track the payoff ratio next to the win rate. Average win divided by average loss. Look at the two numbers together, every time.
- Calculate the break-even win rate. If your real win rate is below it, more trades make the result worse.
- Split results by side. LONG and SHORT can behave very differently, as Genesis Test showed.
- Study the largest losses separately. Count them and note the conditions in which they happened. A few trades often carry most of the damage.
These habits do not create an edge. They show whether one exists. Chan's book on quantitative trading is a practical guide to measuring a system in this way [2].
A made-up example shows how fast the picture turns. Suppose a system wins 70 % of its trades, each win is 1 USDT and each loss is 3 USDT. Out of 10 trades it gains 7 USDT and loses 9 USDT. The win rate looks excellent and the account shrinks.
What the data shows: three bots
| Bot | Win rate | Average win | Average loss | Loss compared with win | Break-even win rate | Net result |
|---|---|---|---|---|---|---|
| Genesis Test | 54.64 % | not recorded | not recorded | not recorded | not recorded | -3.98 USDT |
| Lazarus, 52 trades | 46.15 % | +0.48 USDT | -1.52 USDT | 3.17 times | 76.0 % | negative |
| Nexus, 49 closed records | not meaningful | +0.0608 USDT | -0.2993 USDT | 4.9 times | 83.1 % | -0.3555 USDT |
The win rates, averages and net results are quoted from my audit files as recorded. The break-even column is my own arithmetic from the recorded averages.
Two notes on the table. For Nexus, 43 of the 49 closed records showed a result of zero because of a bookkeeping fault, so I do not quote a win rate for it. For Genesis Test, the averages were not recorded. The arithmetic still gives a limit: at a win rate of 54.64 %, an average loss about 1.2 times the average win is enough to bring the result to zero.
The amounts are small because the wallets were small. The ratios do not depend on the wallet size.
Fees belong to this arithmetic as well. Every trade pays them, win or lose. They make the average win smaller and the average loss larger. I come back to fees in a later lesson.
How Entry Risk Score fits in
Entry Risk Score does not know your win rate or your payoff ratio. It measures one thing on the loss side: how often price moved against an entry soon after similar moments.
In the nine-month check, price moved 1 % against a long entry within 60 minutes after 25.1 % of HIGH moments. After other moments the figure was 13.6 % [3]. For a short-term trade with a stop-loss near 1 %, that move is the full loss. These are past frequencies, not odds.
There is a link between the two topics. An adverse move soon after entry is one way a trade ends at its full stop-loss instead of at a small gain.
The score does not change a payoff ratio by itself. It is one input among several. The stop distance, the profit target and the position size remain your decisions.
Further reading
- The five lessons behind this series: Why I built it: 9 months, 50+ bots, 5 expensive lessons
- The nine-month tables: entryriskscore.com/evidence
- Chan, Quantitative Trading, on backtesting and performance measurement [2]
- Next lesson: why classic indicators do not time entries
Entry Risk Score is a data service. It is not investment advice and makes no promise of returns.
References
[1] Author's post-mortem audit files for the Genesis, Lazarus and Nexus bots, May to July 2026. Unpublished trade logs, amounts quoted as recorded.
[2] Chan, E. P. (2009). Quantitative Trading: How to Build Your Own Algorithmic Trading Business. Wiley.
[3] Entry Risk Score. Evidence: HIGH moments vs all other moments, January to September 2026, score v1.1. https://entryriskscore.com/evidence
References
- Author's post-mortem audit files for the Genesis, Lazarus and Nexus bots, May to July 2026. Unpublished trade logs, amounts quoted as recorded. ↩
- Chan, E. P. (2009). Quantitative Trading: How to Build Your Own Algorithmic Trading Business. Wiley. ↩
- Entry Risk Score. Evidence: HIGH moments vs all other moments, January to September 2026, score v1.1. https://entryriskscore.com/evidence ↩
More in Lessons from bots
Why I built it: 9 months, 50+ bots, 5 expensive lessons
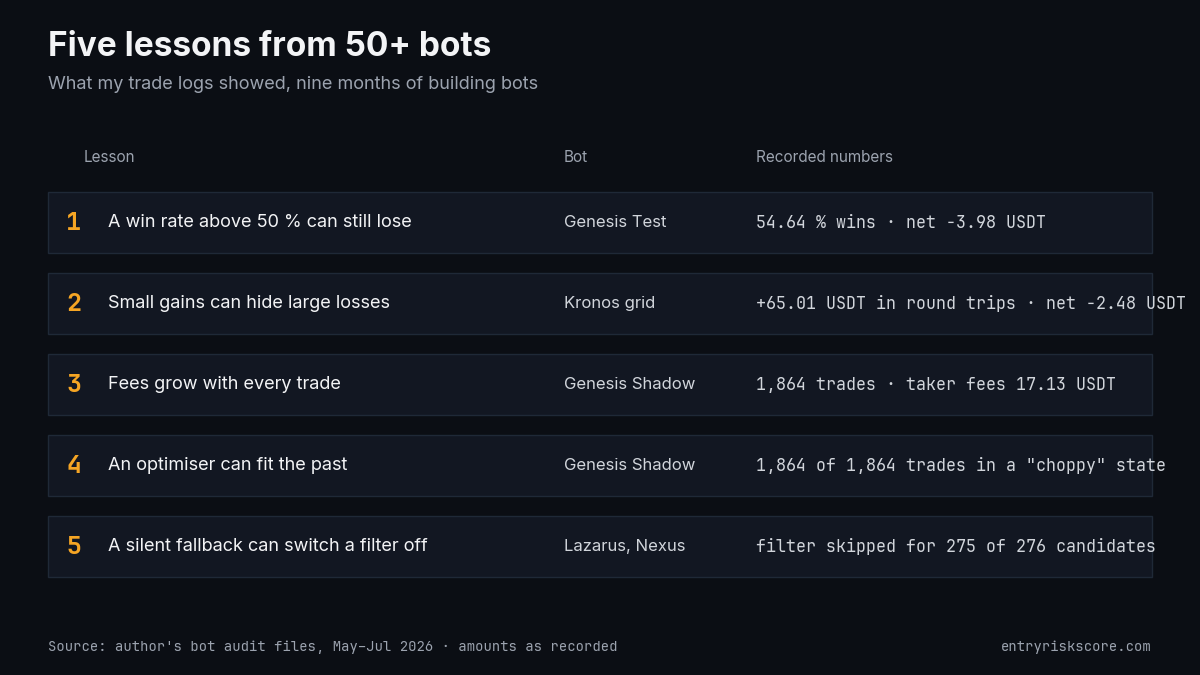
In nine months I built more than 50 trading bots. When I audited the logs, the losses were not fifty stories. They were five. Here they are, with the numbers.