Why I built it: 9 months, 50+ bots, 5 expensive lessons
Know When Not to Enter · Lesson 1/29
The problem: fifty bots, the same few ways to lose
In nine months I built more than 50 trading bots for crypto futures. There were trend bots, mean-reversion bots, grid bots and bots with machine-learning filters. Most of them looked good in testing. Most of them lost money live.
For months I treated each loss as a separate problem. One bot needed a better indicator. Another needed a tighter stop-loss.
Then I did what I should have done first. I put the trade logs of the main bots side by side and audited them [1]. For each bot I counted the trades, the win rate, the average win and loss, the fees, the largest losses and the reason for every exit.
The losses were not fifty different stories. They were five.
Why it happens: the five lessons
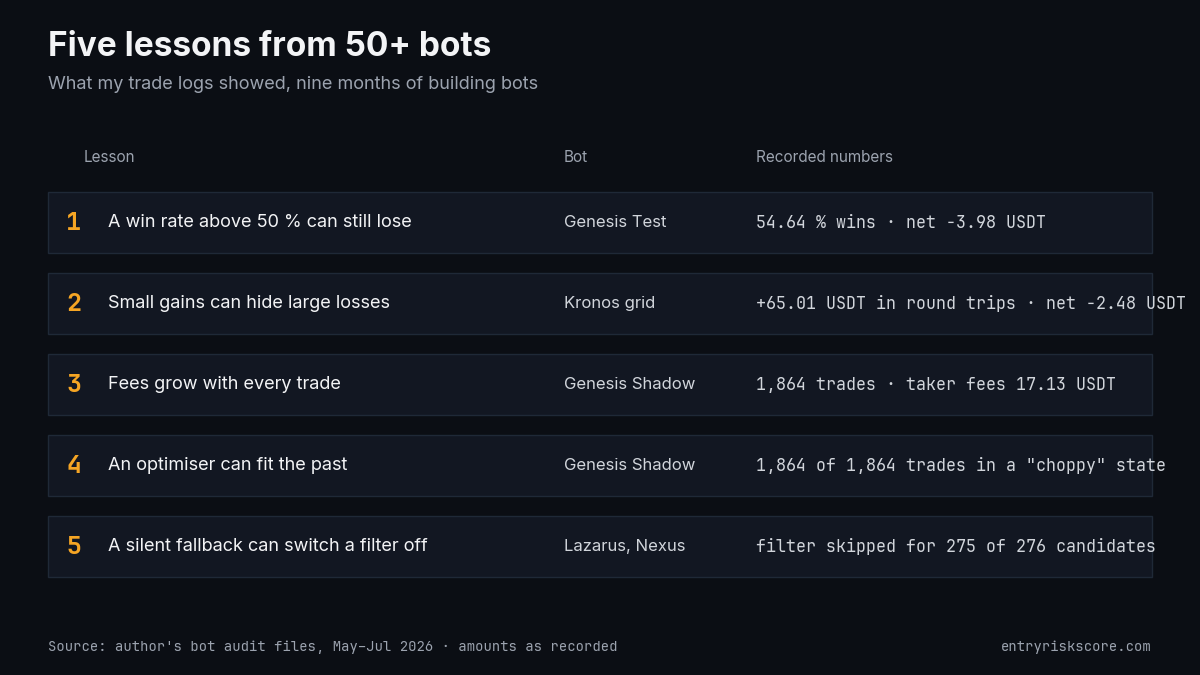
1. A win rate above 50 % can still lose. My Genesis Test fleet won 54.64 % of its trades and ended at -3.98 USDT.
In Lazarus the average losing trade cost 1.52 USDT and the average winner made 0.48 USDT. One loss erased three wins.
2. Many small gains can hide a few large losses. My grid bot Kronos collected +65.01 USDT in small round trips. Stop-loss events, fees and funding took it all back. The bot ended at -2.48 USDT net.
3. Fees grow with every trade. Genesis Shadow made 1,864 trades and recorded 17.13 USDT in taker fees. It ended at -37.31 USDT.
Two lessons that had nothing to do with the market
4. An optimiser can fit the past and miss the present. Every one of those 1,864 trades happened in a market state that my own system labelled "choppy". The tuned parameters sent the bot to trade only in the least promising conditions.
5. A silent fallback can switch a filter off. In Lazarus, a timeout fallback let 275 of 276 entry candidates skip the machine-learning filter. No error was shown.
In Nexus, 43 of 49 closed records showed a result of exactly zero, because dropped connections delayed the bookkeeping.
The amounts are small because the wallets were small. The patterns were the expensive part. They cost me nine months.
What helps: four habits from the audit
- Group losses by pattern across all bots. One bot's log hides the repetition. Five logs side by side show it.
- Track the average loss next to the average win. The win rate alone tells you how often, never how much.
- Put fees into every test at the real trade frequency. A cost that looks small per trade is large at 1,864 trades.
- Log every fallback. Count how often each filter really ran. If the count is near zero, the filter does not exist.
None of these habits is a cure. Each one removes a blind spot.
I do not regret building many bots quickly. Fast prototypes are how ideas get tested. What I lacked was a fixed limit on risk per trade and a paper-trading phase long enough to catch the bugs before real money did.
What the data shows: the audit in one table
| Bot | Type | Recorded result | Lesson |
|---|---|---|---|
| Genesis Test | Test fleet | Win rate 54.64 %, net -3.98 USDT | 1 |
| Lazarus | Z-score mean reversion, 52 trades | Average win +0.48, average loss -1.52 USDT | 1 |
| Kronos | Futures grid | Round trips +65.01; stop-losses, fees and funding took it back; net -2.48 USDT | 2 |
| Genesis Shadow | 1,864 trades | Taker fees 17.13, net -37.31 USDT, all trades in "choppy" state | 3, 4 |
| Lazarus | Machine-learning filter | Skipped for 275 of 276 entry candidates | 5 |
| Nexus | 49 closed records | 43 records with a result of zero | 5 |
All figures come from my own audit files for May to July 2026. I quote them as recorded.
The literature had warned me. López de Prado treats backtest overfitting as a central danger in strategy research [2]. White showed how using the same data again and again to pick a model produces results that look significant and are not [3]. I understood these warnings only after the audit.
How Entry Risk Score fits in
One detail in the audit stayed with me. Several of these bots won about half of their trades or more. What failed was around the direction call: the size of the losses, the costs and the moment of entry.
So I stopped asking where price would go. I asked a smaller question that I could measure: is this a bad moment to enter? Entry Risk Score is the result. It ranks each moment against the coin's own last 90 days, using volatility, funding crowding and the 4-hour move.
It addresses one part of the five lessons, the entry moment. It does nothing about fees, bugs or overfitting in your own system. Those need the habits above. I treat the score as one input among several.
The rest of this series goes through the lessons one at a time. Each post takes one way of losing money, shows the numbers I have for it, and lists the habits that help.
Further reading
- The product in short: What Entry Risk Score does, in 5 minutes
- The nine-month check behind the score: entryriskscore.com/evidence
- López de Prado, Advances in Financial Machine Learning, chapter 11, on what backtests can and cannot show [2]
- Next lesson: 1.5 million moments, and what nine months say about entry timing
Entry Risk Score is a data service. It is not investment advice and makes no promise of returns.
References
[1] Author's post-mortem audit files for the Genesis, Kronos, Lazarus and Nexus bots, May to July 2026. Unpublished trade logs, amounts quoted as recorded.
[2] López de Prado, M. (2018). Advances in Financial Machine Learning. Wiley. Chapter 11, The Dangers of Backtesting.
[3] White, H. (2000). A Reality Check for Data Snooping. Econometrica, 68(5), 1097-1126.
References
- Author's post-mortem audit files for the Genesis, Kronos, Lazarus and Nexus bots, May to July 2026. Unpublished trade logs, amounts quoted as recorded. ↩
- López de Prado, M. (2018). Advances in Financial Machine Learning. Wiley. Chapter 11, The Dangers of Backtesting. ↩
- White, H. (2000). A Reality Check for Data Snooping. Econometrica, 68(5), 1097-1126. ↩