What Entry Risk Score does, in 5 minutes
The problem: a good setup at a bad moment
I have had many trades where the setup was right and the trade still lost. The trend was there. The pattern was there.
I entered, price moved 1 % against me within the hour, and my stop-loss closed the position. Then the move I had expected came, without me.
For a long time I blamed the setup. I changed indicators and tuned parameters. It took nine months and more than 50 trading bots before I saw the simpler point.
The setup describes what I want to trade. It says very little about whether this minute is a bad one to enter.
Why it happens: three kinds of bad moments
When I went through my trade logs, the costly entries fell into the same few situations.
The first is chasing. By the time a move is obvious, price is often far from where the move began. The entry sits where moves tend to pause.
The second is crowding. When the funding rate runs hot, most traders on my side are already in. A small move against them can force many of them out at once.
The third is turbulence. The same setup carries different risk in a quiet hour and in a violent hour. A stop-loss that is reasonable in the first is too tight in the second.
Most tools check the setup. Few check the moment.
What helps: measure the moment before the order
Entry Risk Score is my answer to that gap. It is a data service for Binance USDT-M perpetual futures. Every 5 minutes it measures, for 19 coins and for both sides (LONG and SHORT), how risky it is to enter now.
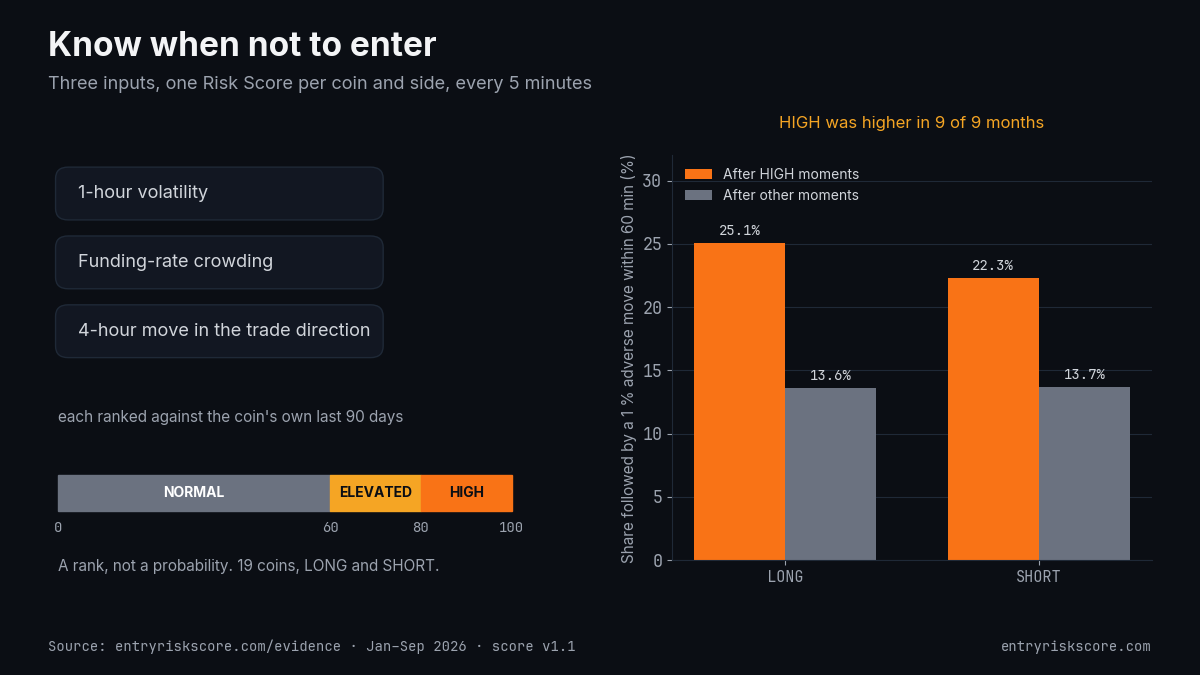
It uses three inputs: 1-hour volatility, funding-rate crowding, and the 4-hour move in the direction of the trade. Each input is compared with the same coin's own last 90 days.
The result is a Risk Score from 0 to 100. A score of 86 means: riskier to enter than 86 % of that coin's own recent moments. It is a rank, not a probability [2].
What HIGH means
HIGH means 80 and above, the coin's own riskiest fifth of moments. "Risk" has a fixed meaning here: price moved against the entry by 1 % within 60 minutes. There are two longer profiles as well: 2 % within 8 hours and 3 % within 24 hours.
The score never gives direction. It never tells you to open or close a position. It answers one narrow question, and you decide what to do with the answer.
What the data shows: nine months, rules frozen
I froze the rules and recomputed the score for January to September 2026 from Binance archives. That is about 1.5 million moments across the 19 coins [1].
| Entry held 60 minutes, adverse move 1 % | After HIGH moments | After other moments | Months HIGH was higher |
|---|---|---|---|
| LONG | 25.1 % | 13.6 % | 9 of 9 |
| SHORT | 22.3 % | 13.7 % | 9 of 9 |
After HIGH moments, the 1 % adverse move happened 25.1 % of the time on the long side. After all other moments it happened 13.6 % of the time. In the last three months of that period the long side showed 29.2 % against 12.9 %.
These are past frequencies. They are not odds for your next trade. Most HIGH moments were not followed by the adverse move, and many other moments were. The full tables, including the weaker months, are on the evidence page.
How Entry Risk Score fits in: where you see it
If you trade by hand, there is a live board on the web, Telegram alarms with sound when a coin turns HIGH, and an hourly risk table. If you run a bot or an AI agent, there is a REST API, an MCP server, and ERS Guard. ERS Guard is an open-source client on GitHub that adds the check to a bot in a few lines [3]. A chart indicator for TradingView, called Chart Lens, is in preparation.
What is different
Two things are different from most tools I have used. The nine-month check is public, with the weak months left in. There is also a public daily ledger.
The ledger publishes how often HIGH moments were followed by the adverse move in live measurement, bad days included. Each entry carries a SHA-256 hash and is chained to the entry before it, so a past entry cannot be changed quietly.
The score is one input among several. It does not replace a setup, a stop-loss or position sizing.
What it costs
The trial is free for 7 days and covers 10 coins in real time. Full access to all 19 coins costs 10 USDT a month or 84 USDT a year.
Next steps
- Read the evidence tables, month by month and coin by coin: entryriskscore.com/evidence
- Read how the score is built, in plain words: entryriskscore.com/methodology
- Bot builders and AI-agent users: start with the developer docs
- Next in this series, Lesson 1: why I built this, and the five lessons that 50 bots taught me
Entry Risk Score is a data service. It is not investment advice and makes no promise of returns.
References
[1] Entry Risk Score. Evidence: HIGH moments vs all other moments, January to September 2026, score v1.1. https://entryriskscore.com/evidence
[2] Entry Risk Score. Methodology, score v1.1. https://entryriskscore.com/methodology
[3] Entry Risk Score. Developer docs: REST API, MCP server and ERS Guard. https://entryriskscore.com/docs
References
- Entry Risk Score. Evidence: HIGH moments vs all other moments, January to September 2026, score v1.1. https://entryriskscore.com/evidence ↩
- Entry Risk Score. Methodology, score v1.1. https://entryriskscore.com/methodology ↩
- Entry Risk Score. Developer docs: REST API, MCP server and ERS Guard. https://entryriskscore.com/docs ↩