1.5 million moments: what nine months say about entry timing
Know When Not to Enter · Lesson 2/29
The problem: a claim needs a check
After fifty bots I do not trust my own backtests. I have seen too many curves that looked fine until real money met them.
So when I built a score that calls some moments HIGH, I owed myself a hard question. Were HIGH moments really followed by more adverse moves? Or did I only like the idea?
Why it happens: how a check can fool you
A check can fail in quiet ways. I can tune the rules on the same data I test them on. I can pick the months that look good. I can decide what counts as success after I have seen the result.
White described this problem as data snooping [3]. The defence is to fix every definition before counting.
So I fixed three things. A "moment" is one 5-minute snapshot of one coin. HIGH is a Risk Score of 80 or above.
The outcome is fixed too: did price touch the adverse level against the entry before the holding period ended? The levels are 1 % in 60 minutes, 2 % in 8 hours and 3 % in 24 hours, measured on 1-minute highs and lows [2].
Then I recomputed January to September 2026 from Binance archives with the frozen rules of score version 1.1. That gave 1,488,403 moments for 19 coins. About one in five was HIGH, which follows from the definition [1].
What helps: how to read a table like this
- Compare the two columns. A rate of 25 % means nothing alone. It needs the rate of all other moments beside it.
- Look at each month. A pooled number can hide months where the result turned around.
- Read the weak rows first. They show where the score deserves less trust.
- Remember that neighbours overlap. Two moments five minutes apart share most of their future. 1.5 million moments are far fewer independent observations.
What the data shows: the full table
| Holding period and adverse move | Side | After HIGH | After other | Difference (points) | Months HIGH was higher |
|---|---|---|---|---|---|
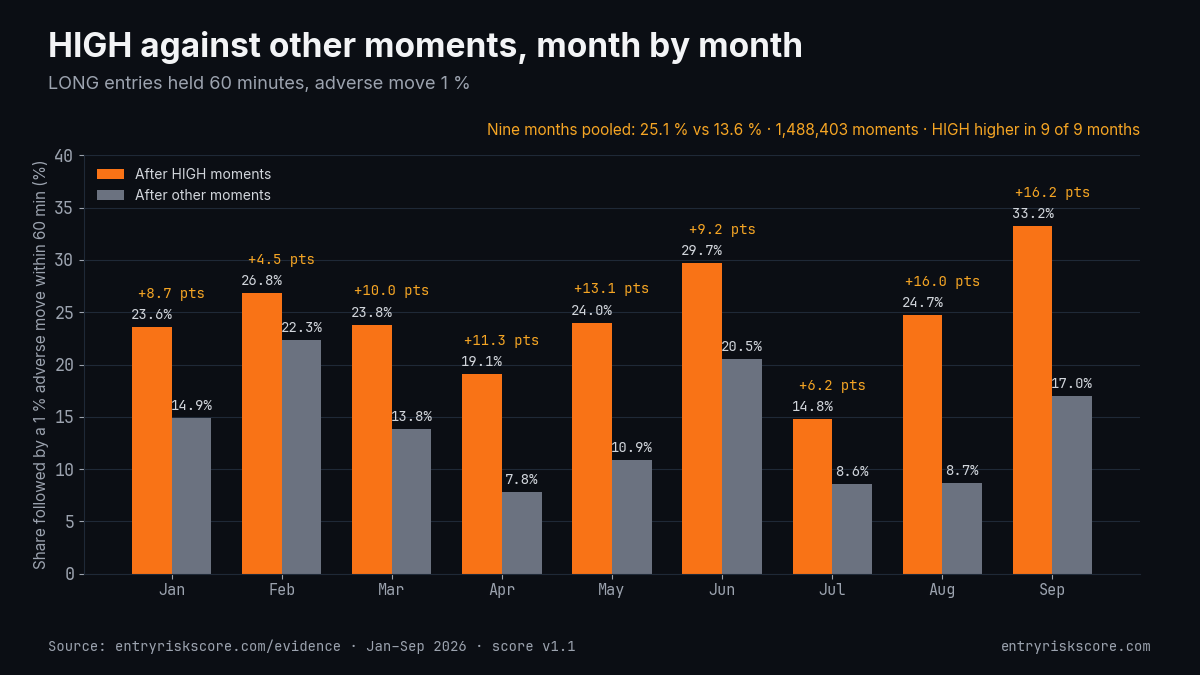
| 60 minutes, 1 % | LONG | 25.1 % | 13.6 % | +11.5 | 9 of 9 |
| 60 minutes, 1 % | SHORT | 22.3 % | 13.7 % | +8.7 | 9 of 9 |
| 8 hours, 2 % | LONG | 35.7 % | 26.0 % | +9.7 | 8 of 9 |
| 8 hours, 2 % | SHORT | 33.6 % | 25.0 % | +8.6 | 8 of 9 |
| 24 hours, 3 % | LONG | 40.8 % | 33.4 % | +7.3 | 7 of 9 |
| 24 hours, 3 % | SHORT | 37.0 % | 31.1 % | +5.9 | 8 of 9 |
The 60-minute profile separated in every month, on both sides. On the long side, the adverse move followed HIGH moments about 1.8 times as often as other moments. The longer the holding period, the smaller the difference.
The weak months
On the 24-hour LONG profile, HIGH moments were followed by the adverse move less often than other moments in January (-3.6 points) and February (-4.5 points). The 8-hour LONG profile was slightly negative in February (-1.5). In September the SHORT side turned negative on the 8-hour profile (-2.1) and the 24-hour profile (-3.2). In April the 60-minute SHORT difference was only +0.5 points, which is close to nothing.
The last three months
From July to September the long side was stronger than the nine-month average: 29.2 % against 12.9 % on the 60-minute profile, a difference of +16.4 points. The short side was weaker: 21.9 % against 16.2 %, a difference of +5.7 points.
Three months are a short window. I show it because recent behaviour matters to anyone who uses the score now, and because it shows the two sides moving apart.
Coin by coin
The pooled numbers hide large differences between coins. On the 60-minute LONG profile, NEAR showed 43.5 % after HIGH moments against 22.5 % after other moments. BTC showed 8.2 % against 4.6 %.
TRX, a very calm coin, showed 1.0 % against 0.8 %, which is almost no separation. The score is not equally informative on every coin, and a later lesson looks at the coins one by one.
One more limit belongs here. The same nine months also informed the move from version 1.0 to version 1.1 of the score. So this table is a check on frozen rules. It is not a clean test on unseen data.
How Entry Risk Score fits in
The clean test is the live one. Since 3 October 2026 the score is measured live, and a public daily ledger publishes how often HIGH moments were followed by the adverse move. Each entry is hash-chained to the one before it, and bad days stay in.
I also keep the base rate in mind. On the 60-minute LONG profile, about three out of four HIGH moments were not followed by the 1 % adverse move. HIGH is a reason to look twice at an entry. It is one input among several, and it decides nothing by itself.
In practice I rely most on the 60-minute profile, where the record is the most consistent. I read the 24-hour profile with more caution, and the short side with more caution than the long side. If the live ledger shows a different picture over the coming months, I change that reading.
Further reading
- The full tables, by month and by coin: entryriskscore.com/evidence
- How the score and the outcome labels are defined: entryriskscore.com/methodology
- The previous lesson: Why I built it: 9 months, 50+ bots, 5 expensive lessons
- Next lesson: the win-rate illusion
Entry Risk Score is a data service. It is not investment advice and makes no promise of returns.
References
[1] Entry Risk Score. Evidence: HIGH moments vs all other moments, January to September 2026, score v1.1. https://entryriskscore.com/evidence
[2] Entry Risk Score. Methodology, score v1.1. https://entryriskscore.com/methodology
[3] White, H. (2000). A Reality Check for Data Snooping. Econometrica, 68(5), 1097-1126.
References
- Entry Risk Score. Evidence: HIGH moments vs all other moments, January to September 2026, score v1.1. https://entryriskscore.com/evidence ↩
- Entry Risk Score. Methodology, score v1.1. https://entryriskscore.com/methodology ↩
- White, H. (2000). A Reality Check for Data Snooping. Econometrica, 68(5), 1097-1126. ↩