Chasing the move: the 4-hour run-up
Know When Not to Enter · Lesson 5/29
The problem: the move is obvious, so I enter
A coin has been rising for four hours. The candles are green, the volume is up, and the breakout is clear to everyone. I enter long.
Within the hour price pauses and pulls back 1 %. My stop-loss closes the trade. Later the rise continues.
I have done this by hand. Then I automated it. Several of my bots were built to find coins that were already moving and to join them.
MoverSniper was one of them. I cannot quote clean results for it, because its records had a flaw that I describe in a later lesson. The pattern itself I know well.
Why it happens: a late entry has no room
When a move is obvious, a large part of it is behind me. That changes three things at once.
First, my stop-loss has no good place. If I put it close, normal noise reaches it. If I put it below the start of the move, the loss is large.
Second, traders who entered early now hold a profit. Some of them close. Their closing orders push price against the late entries.
Third, the late entries share the same weak position. Many stops sit in the same narrow zone just below the price. A small pullback can reach all of them together.
None of this means the move is over. It means the next hour is rougher for a new entry than it was four hours earlier.
The same logic applies to the short side. After a fall of several hours, a new short entry sits where early shorts take their gains and where a bounce reaches the late stops.
What helps: measure the stretch before you join
- Measure the run-up in ATR. Average true range (ATR) is a common measure of how much a coin normally moves in one period [3]. A 3 % rise is large for a calm coin and ordinary for a volatile one. In ATR units the two become comparable.
- Decide the stop distance first. If no reasonable stop exists at the current price, the entry is late.
- Wait for a pause or a pullback. An entry after a pause has a nearer reference point for the stop.
- Reduce the position size when the move is stretched. A smaller position leaves room for a wider stop at the same loss in money.
These habits do not tell me whether the move continues. They only keep me from entering at its most crowded point. Lebron's book on trading decisions is useful background on thinking about who is on the other side of a trade [4].
What the data shows: HIGH moments on the long side
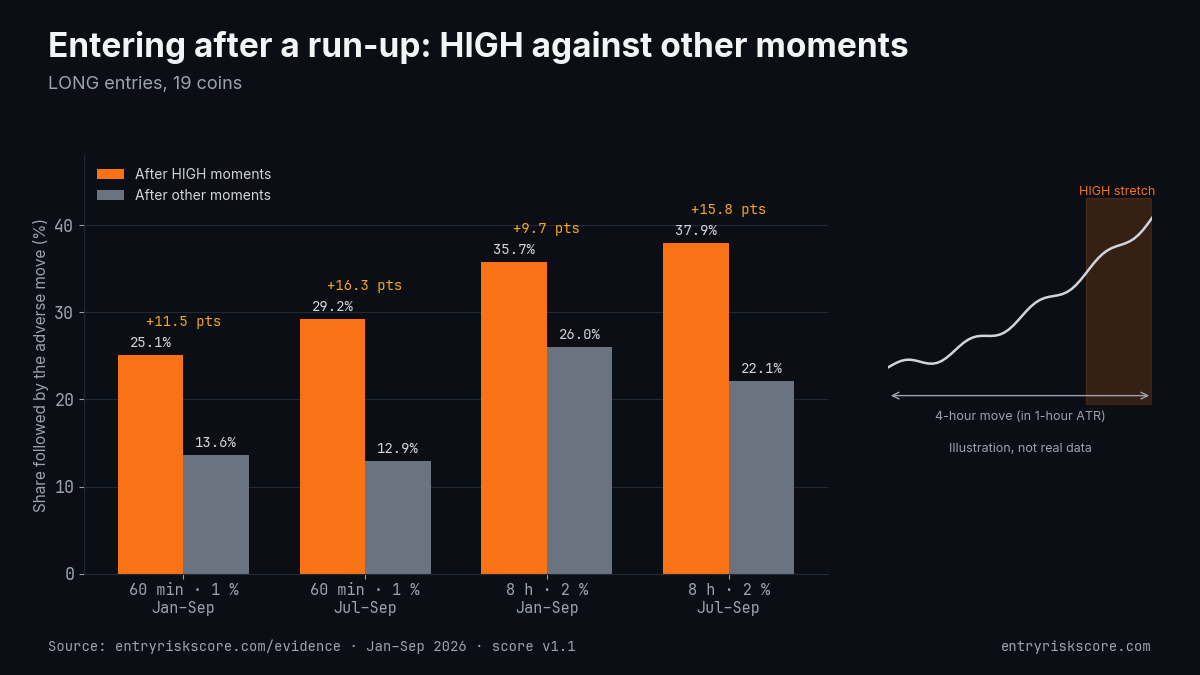
One of the three inputs of Entry Risk Score is this stretch. It is the price change over the last 4 hours, measured in 1-hour ATR. A rise counts against a LONG entry. For a SHORT entry the sign is reversed, so a fall counts against it [1].
Why four hours? I also measured shorter windows as candidate inputs. They did not separate adverse outcomes and were dropped. The 4-hour window stayed.
I do not publish a separate result for each input. The table shows the full score, which also includes volatility and funding crowding. It covers LONG entries [2].
| Holding period and adverse move | Period | After HIGH moments | After other moments | Difference (points) |
|---|---|---|---|---|
| 60 minutes, 1 % | January to September 2026 | 25.1 % | 13.6 % | +11.5 |
| 60 minutes, 1 % | July to September 2026 | 29.2 % | 12.9 % | +16.4 |
| 8 hours, 2 % | January to September 2026 | 35.7 % | 26.0 % | +9.7 |
| 8 hours, 2 % | July to September 2026 | 37.9 % | 22.1 % | +15.8 |
In the last three months, price moved 2 % against a long entry within 8 hours after 37.9 % of HIGH moments. After other moments it was 22.1 %. HIGH was higher in all three months.
The nine-month view has one exception. In February 2026 the 8-hour LONG profile showed HIGH slightly lower than other moments, by 1.5 points.
The short side was weaker
On the short side the recent record is thin. From July to September, the 8-hour SHORT profile showed 33.1 % after HIGH moments against 28.9 % after other moments. HIGH was higher in only one of the three months. I rely on the score less for short entries held for hours.
These are past frequencies. They are not odds for a future trade.
How Entry Risk Score fits in
The score makes the stretch visible before the order. Every 5 minutes it compares the 4-hour move with the same coin's own last 90 days. It then combines that with the two other inputs into a Risk Score from 0 to 100. HIGH means 80 or above.
It does not say that a rising coin is about to fall. It never gives direction. It tells me that entries at similar moments were followed by an adverse move more often in the past. I use it as one input among several, next to my setup and my stop plan.
Further reading
- How the 4-hour input is defined: entryriskscore.com/methodology
- All profiles, months and coins: 1.5 million moments: what nine months say about entry timing
- Why a correct reading can still be a bad entry: Classic indicators don't time entries
- Next lesson: crowded funding, when everyone is on your side
Entry Risk Score is a data service. It is not investment advice and makes no promise of returns.
References
[1] Entry Risk Score. Methodology, score v1.1. https://entryriskscore.com/methodology
[2] Entry Risk Score. Evidence: HIGH moments vs all other moments, January to September 2026, score v1.1. https://entryriskscore.com/evidence
[3] Wilder, J. W. (1978). New Concepts in Technical Trading Systems. Trend Research.
[4] Lebron, A. (2019). The Laws of Trading: A Trader's Guide to Better Decision-Making for Everyone. Wiley.
References
- Entry Risk Score. Methodology, score v1.1. https://entryriskscore.com/methodology ↩
- Entry Risk Score. Evidence: HIGH moments vs all other moments, January to September 2026, score v1.1. https://entryriskscore.com/evidence ↩
- Wilder, J. W. (1978). New Concepts in Technical Trading Systems. Trend Research. ↩
- Lebron, A. (2019). The Laws of Trading: A Trader's Guide to Better Decision-Making for Everyone. Wiley. ↩
More in Entry timing
Classic indicators don't time entries
RSI, MACD and bands describe direction and state. They were not built to say whether this minute is a bad one to enter. What my bots taught me about that gap.
1.5 million moments: what nine months say about entry timing
I froze the rules and recomputed nine months of Binance futures data. Here is what HIGH moments were followed by, in plain words, weak months included.